Structure with a DataStore#
Welcome to the tutorial on structuring our Panel app with a DataStore! Here, we’ll delve into the powerful DataStore design pattern, which forms the backbone of many successful applications.
Understanding the DataStore Design Pattern#
The DataStore design pattern has emerged as a reliable solution across diverse application scenarios. At its core:
Data Transformation: The
DataStorecomponent ingests rawdataalong withfilters, and then orchestrates transformations based on these inputs.Consumption by Views: Transformed data is then consumed by one or more
Viewcomponents, enabling flexible visualization and interaction.Reusable Components: These components are designed to be reusable, facilitating seamless integration in both notebooks and standalone applications.
import panel as pn
pn.extension('tabulator', 'vega', throttled=True)
Build the App#
The Data Store#
Let’s start by creating the core DataStore component. Copy the following code into a new file named data_store.py.
import param
import panel as pn
import pandas as pd
from panel.viewable import Viewer

CARD_STYLE = """
:host {{
  box-shadow: rgba(50, 50, 93, 0.25) 0px 6px 12px -2px, rgba(0, 0, 0, 0.3) 0px 3px 7px -3px;
  padding: {padding};
}} """

TURBINES_URL = "https://assets.holoviz.org/panel/tutorials/turbines.csv.gz"

@pn.cache(ttl=15 * 60)
def get_turbines():
    return pd.read_csv(TURBINES_URL)


class DataStore(Viewer):
    data = param.DataFrame()

    filters = param.List(constant=True)

    def __init__(self, **params):
        super().__init__(**params)
        dfx = self.param.data.rx()
        widgets = []
        for filt in self.filters:
            dtype = self.data.dtypes[filt]
            if dtype.kind == "f":
                widget = pn.widgets.RangeSlider(
                    name=filt, start=dfx[filt].min(), end=dfx[filt].max()
                )
                condition = dfx[filt].between(*widget.rx())
            else:
                options = dfx[filt].unique().tolist()
                widget = pn.widgets.MultiChoice(name=filt, options=options)
                condition = dfx[filt].isin(widget.rx().rx.where(widget, options))
            dfx = dfx[condition]
            widgets.append(widget)
        self.filtered = dfx
        self.count = dfx.rx.len()
        self.total_capacity = dfx.t_cap.sum()
        self.avg_capacity = dfx.t_cap.mean()
        self.avg_rotor_diameter = dfx.t_rd.mean()
        self.top_manufacturers = (
            dfx.groupby("t_manu").p_cap.sum().sort_values().iloc[-10:].index.to_list()
        )
        self._widgets = widgets

    def filter(
        self,
    ):
        return

    def __panel__(self):
        return pn.Column(
            "## Filters",
            *self._widgets,
            stylesheets=[CARD_STYLE.format(padding="5px 10px")],
            margin=10
        )
Note
The DataStore class serves as the engine for transforming data. It performs various transformations based on provided filters.
Initialize with
data.Update calculations when
filterschange.
Continuing with Views#
After defining the DataStore, we’ll create View components that leverage the transformed data. This enables diverse ways of visualizing and interacting with the data. Copy the code into a new file named views.py.
import altair as alt
import param
# from data_store import DataStore, CARD_STYLE
from panel.viewable import Viewer
import panel as pn

class View(Viewer):
    data_store = param.ClassSelector(class_=DataStore)


class Table(View):
    columns = param.List(
        default=["p_name", "p_year", "t_state", "t_county", "t_manu", "t_cap", "p_cap"]
    )

    def __panel__(self):
        data = self.data_store.filtered[self.param.columns]
        return pn.widgets.Tabulator(
            data,
            pagination="remote",
            page_size=13,
            stylesheets=[CARD_STYLE.format(padding="10px")],
            margin=10,
        )


class Histogram(View):
    def __panel__(self):
        df = self.data_store.filtered
        df = df[df.t_manu.isin(self.data_store.top_manufacturers)]
        fig = (
            pn.rx(alt.Chart)(
                (df.rx.len() > 5000).rx.where(df.sample(5000), df),
                title="Capacity by Manufacturer",
            )
            .mark_circle(size=8)
            .encode(
                y="t_manu:N",
                x="p_cap:Q",
                yOffset="jitter:Q",
                color=alt.Color("t_manu:N").legend(None),
            )
            .transform_calculate(jitter="sqrt(-2*log(random()))*cos(2*PI*random())")
            .properties(
                height=400,
                width=600,
            )
        )
        return pn.pane.Vega(
            fig, stylesheets=[CARD_STYLE.format(padding="0")], margin=10
        )


class Indicators(View):
    def __panel__(self):
        style = {"stylesheets": [CARD_STYLE.format(padding="10px")]}
        return pn.FlexBox(
            pn.indicators.Number(
                value=self.data_store.total_capacity / 1e6,
                name="Total Capacity (TW)",
                format="{value:,.2f}",
                **style
            ),
            pn.indicators.Number(
                value=self.data_store.count,
                name="Count",
                format="{value:,.0f}",
                **style
            ),
            pn.indicators.Number(
                value=self.data_store.avg_capacity,
                name="Avg. Capacity (kW)",
                format="{value:,.2f}",
                **style
            ),
            pn.indicators.Number(
                value=self.data_store.avg_rotor_diameter,
                name="Avg. Rotor Diameter (m)",
                format="{value:,.2f}",
                **style
            ),
        )
Note
By establishing a base View class linked to the DataStore, we can create various concrete View classes tailored to different visualization requirements.
Assembling the App#
With the DataStore and View components in place, we’ll now assemble the complete app. Copy the code below into a new file named app.py.
import param
from panel.viewable import Viewer
from data_store import DataStore, get_turbines
from views import Indicators, Histogram, Table

import panel as pn

pn.extension("tabulator", "vega", throttled=True)

class App(Viewer):
    data_store = param.ClassSelector(class_=DataStore)

    title = param.String()

    views = param.List()

    def __init__(self, **params):
        super().__init__(**params)
        updating = self.data_store.filtered.rx.updating()
        updating.rx.watch(
            lambda updating: pn.state.curdoc.hold()
            if updating
            else pn.state.curdoc.unhold()
        )
        self._views = pn.FlexBox(
            *(view(data_store=self.data_store) for view in self.views), loading=updating
        )
        self._template = pn.template.MaterialTemplate(title=self.title)
        self._template.sidebar.append(self.data_store)
        self._template.main.append(self._views)

    def servable(self):
        if pn.state.served:
            return self._template.servable()
        return self

    def __panel__(self):
        return pn.Row(self.data_store, self._views)


data = get_turbines()
ds = DataStore(data=data, filters=["p_year", "p_cap", "t_manu"])

App(
    data_store=ds, views=[Indicators, Histogram, Table], title="Windturbine Explorer"
).servable()
Once saved, run panel serve app.py --autoreload in your terminal to launch the app.
The app will look something like
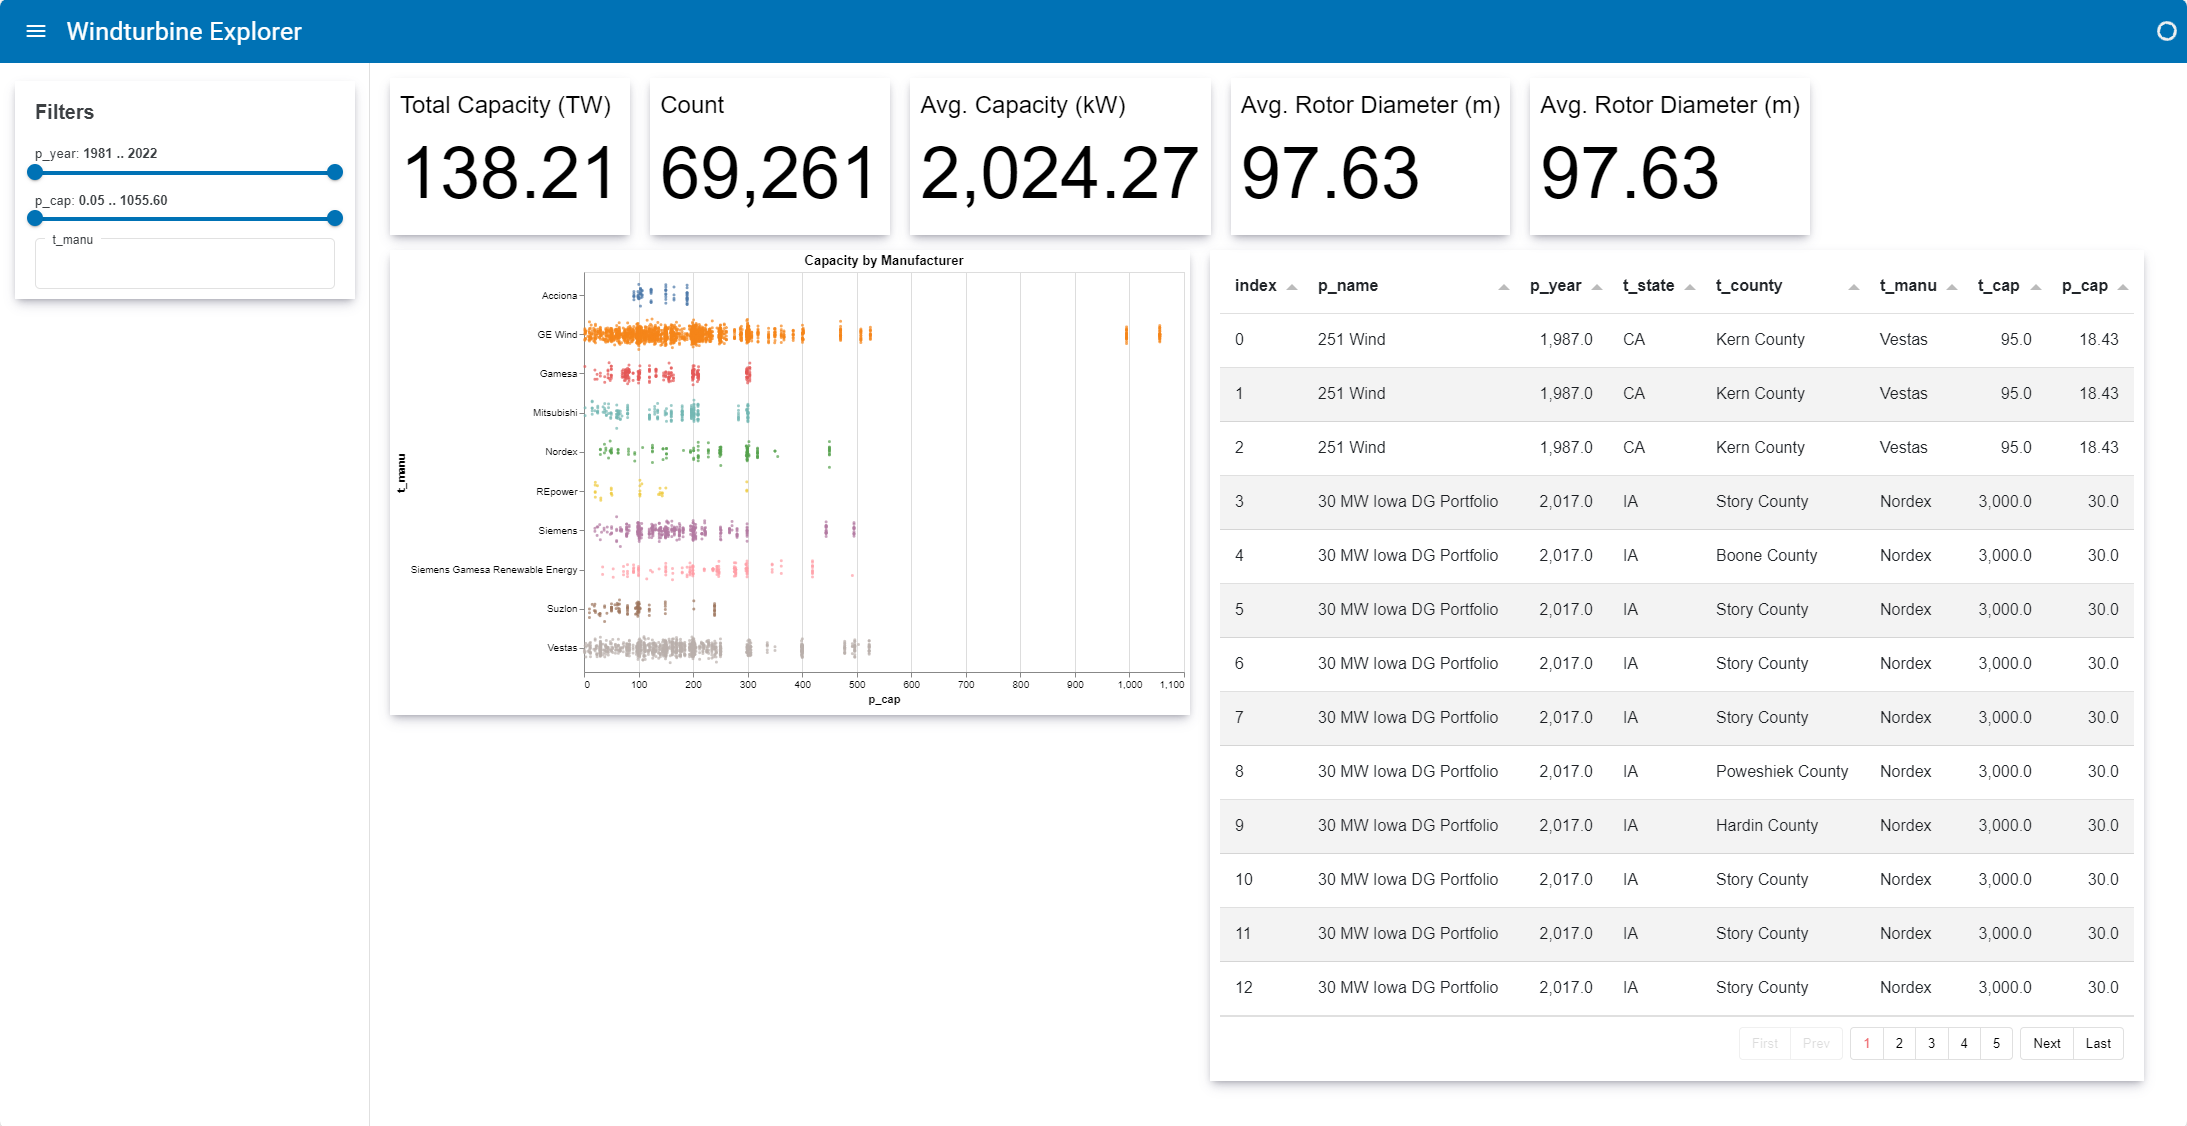
Reuse in a Notebook#
The compositional approach of constructing application components enables their seamless integration into various contexts, including notebooks. Copy the following cells into a notebook, ensuring to uncomment the imports, and execute them.
# from data_store import DataStore, get_turbines
# from views import Indicators, Histogram, Table

import panel as pn

pn.extension("tabulator", "vega", throttled=True)
turbines = get_turbines()

ds = DataStore(data=turbines, filters=['p_year', 'p_cap', 't_manu'])

pn.Row(
    ds,
    pn.Tabs(
        ('Indicators', Indicators(data_store=ds)),
        ('Histogram', Histogram(data_store=ds)),
        ('Table', Table(data_store=ds)),
        sizing_mode='stretch_width',
    )
).servable()
Recap#
In this tutorial, we’ve explored:
The versatility of the
DataStoredesign pattern, which adapts to diverse use cases.The seamless integration of
DataStoreandViewcomponents, enabling flexible data exploration and visualization.The reusability of these components across notebooks and standalone applications.
Ready to apply these principles in your own projects? Let’s embark on your Panel journey! 🚀
